Temporal detector versus heuristics
Compare learned detection with the deterministic baseline on equal terms.
- Train a bounded temporal-artifact detector on sampled sequences.
- Compare it with CineQC's deterministic baseline on one fixed test set.
- Calculate precision, recall, F1, PR curves, calibration, thresholds, and error galleries from saved predictions.
Identify test-set threshold tuning and move the choice to validation production cost.
Compare learned and deterministic systems on equal terms. Required route: fixed-set protocol (55 min), metric computation (85 min), thresholds/calibration (70 min), benchmark build (100 min), error analysis (45 min), transfer/evidence (65 min). Total: 7 hours, including the selected reading.
Entry diagnostic
A threshold chosen on the test set gives the best F1. Explain why that result is no longer an untouched estimate and where threshold selection belongs.
Self-check
Why must the temporal model and deterministic CineQC baseline receive the same fixed test-set item IDs and label ontology?
Why this matters in CineQC
A learned detector is valuable only when it improves a named production trade-off. Compare it with the deterministic baseline using saved per-item predictions, reproducible metric code, and visible errors. Never replace a cheap inspectable fallback merely because one aggregate number is higher.
Visual model — predictions to decision
A fixed prediction timeline shows false-positive and false-negative outcomes at thresholds 0.50 and 0.70.
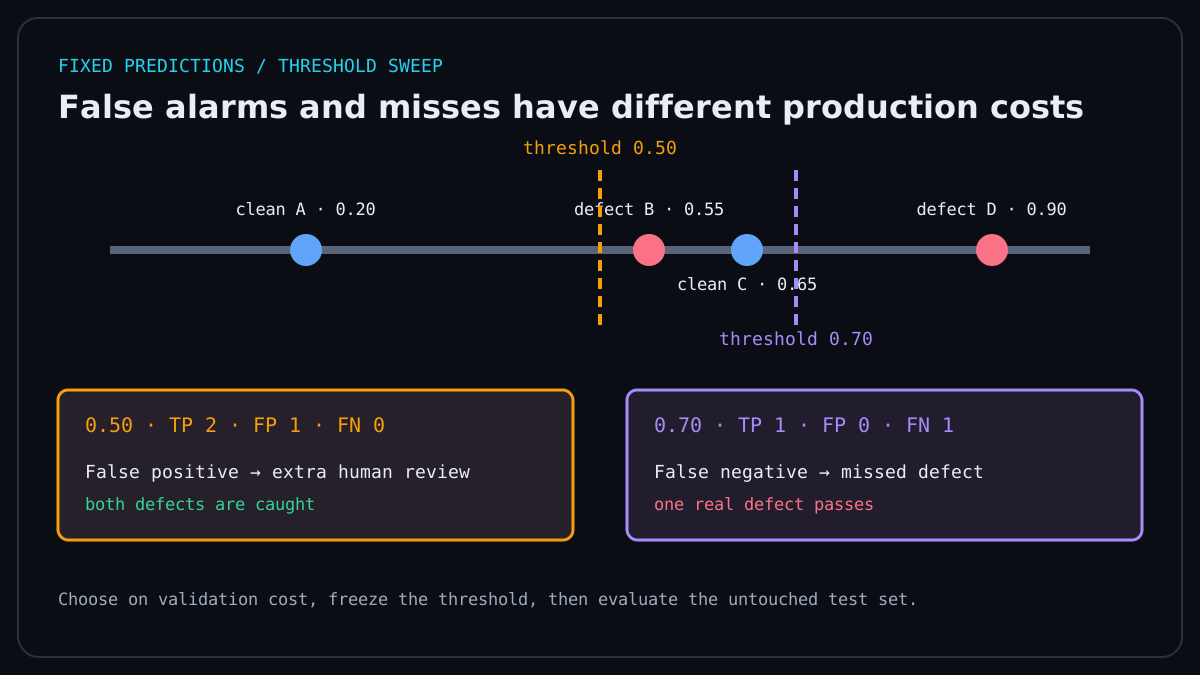
Use fixed test items → saved scores → recomputed metrics → error gallery → production threshold. Save one row per item and system with item ID, true label, score, threshold-independent metadata, model/baseline identity, dataset version, and run ID.
For one-vs-rest artifact detection: precision = TP/(TP+FP), recall = TP/(TP+FN), and F1 = 2PR/(P+R). A confusion matrix shows the four counts at one threshold. A PR curve sweeps thresholds and is especially useful with rare defects. Calibration asks whether predicted probability matches observed frequency; it is distinct from ranking quality.
Runtime: Local Python 3.12 · standard library · CPU-safe · 20 min.
rows = [(1, .90), (0, .80), (1, .70), (0, .20), (1, .10)]

def metrics(items, threshold):
    tp = sum(y == 1 and score >= threshold for y, score in items)
    fp = sum(y == 0 and score >= threshold for y, score in items)
    fn = sum(y == 1 and score < threshold for y, score in items)
    tn = sum(y == 0 and score < threshold for y, score in items)
    precision = tp / (tp + fp) if tp + fp else 0.0
    recall = tp / (tp + fn) if tp + fn else 0.0
    f1 = 2 * precision * recall / (precision + recall) if precision + recall else 0.0
    return {"tp": tp, "fp": fp, "fn": fn, "tn": tn,
            "precision": precision, "recall": recall, "f1": f1}

print(metrics(rows, 0.5))
Recompute every displayed metric from saved predictions. Do not type prose-only numbers into the report. Add assertions for the confusion-matrix total and item-ID equality between systems.
Self-check
Can two systems share F1 yet impose different review cost? Name the false-positive and false-negative consequences.
Thresholds, calibration, and cost
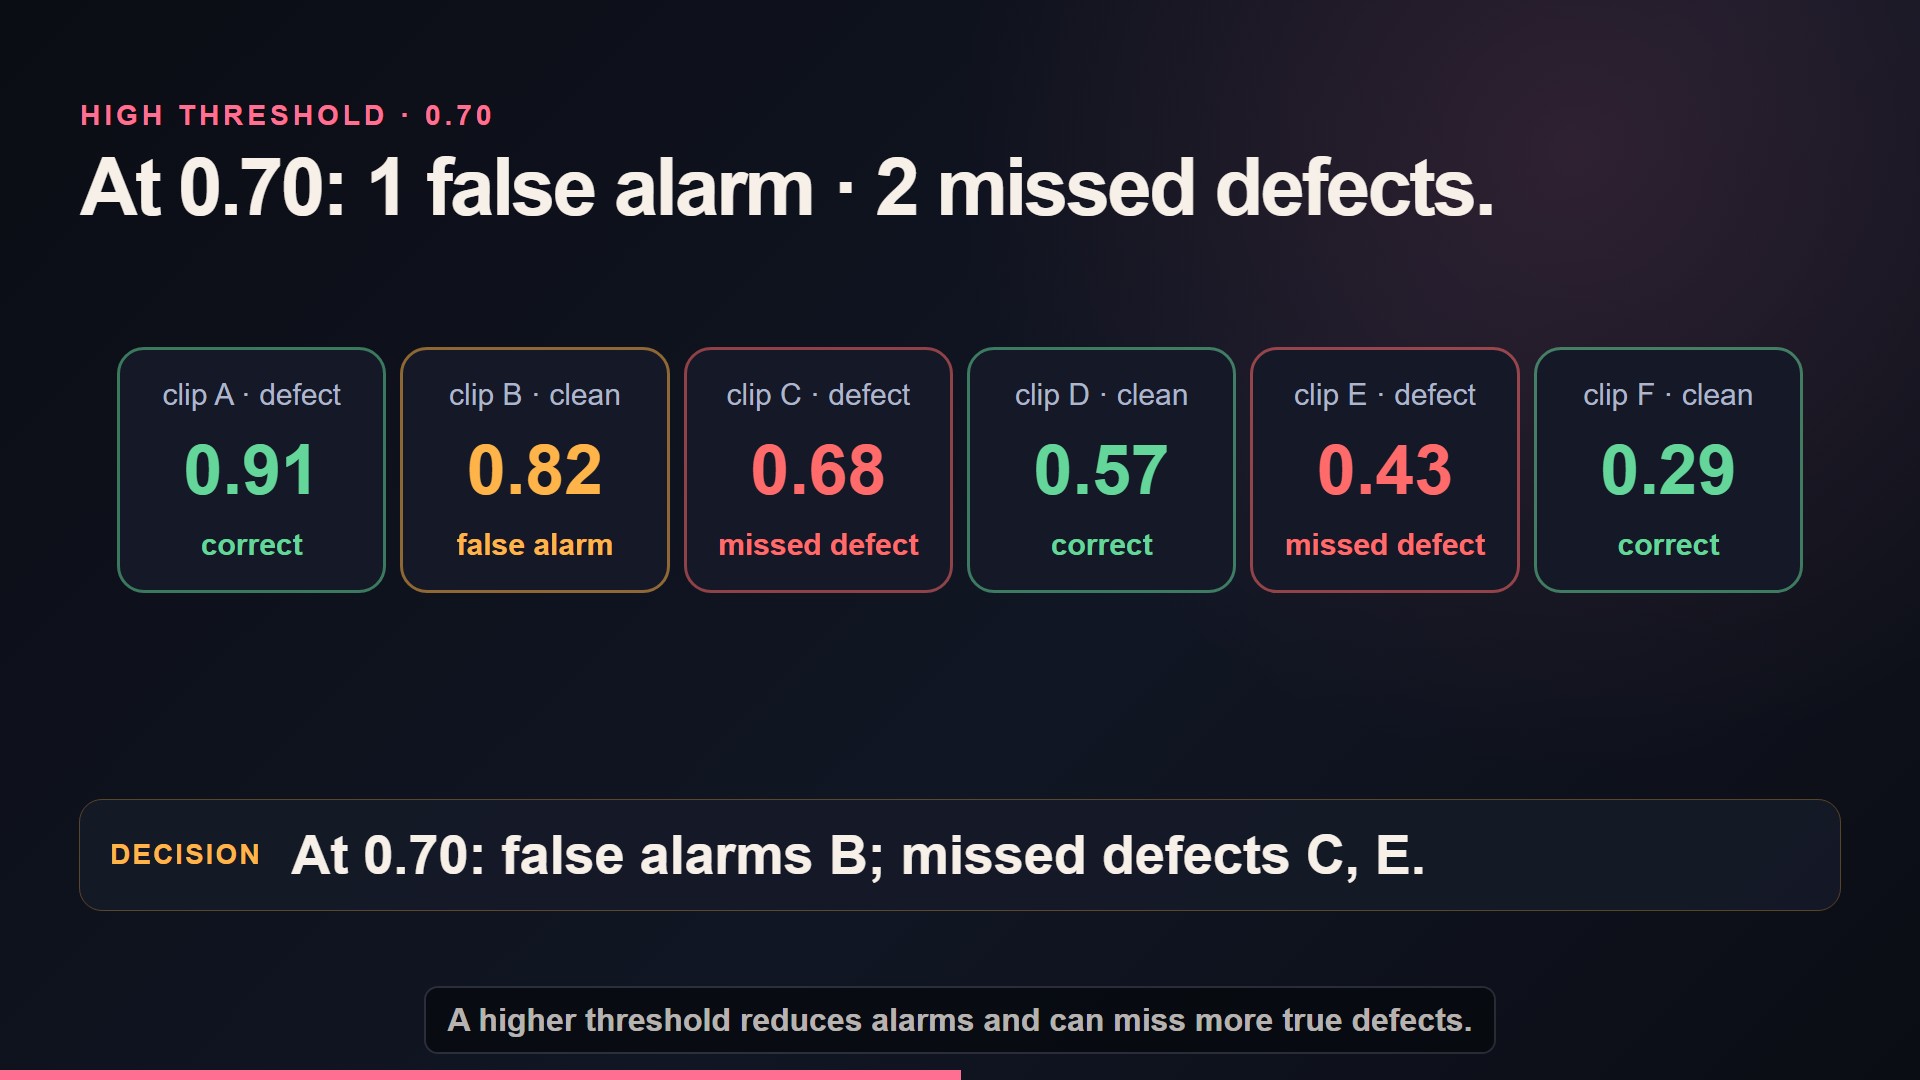
Fixed prediction table with three thresholds and their error counts. If the video cannot play, this image and the transcript preserve the complete teaching claim.
Choose candidate thresholds on validation data. Write a simple production cost such as 5 × false negatives + 1 × false positives; justify the weights with review capacity and harm, then freeze the threshold before test evaluation. Show the confusion matrix at that point and the complete PR curve. Inspect reliability bins if scores are presented as probabilities; otherwise call them scores.
An ablation changes one component—temporal window, augmentation, pretrained weights, or heuristic feature—while holding split and evaluation code fixed. Keep two high-information ablations, not a combinatorial search.
Sandbox lab
Build the Temporal Detector Benchmark from dataset v1. Run the learned temporal model and five-signal CineQC baseline on the identical fixed test set. Save predictions as JSONL/CSV, generate metrics and PR data from those files, and render a confusion matrix plus false-positive/false-negative error gallery using lawful thumbnails or abstract timelines.
The gallery must connect each error to source-safe context and a next hypothesis. Keep private media in a private report; publish sanitized IDs, diagrams, and aggregate results only.
Failure clinic
Repair these failures: thresholds tuned on test; baseline and model evaluated on different items; macro/micro F1 left unnamed; division by zero hidden; scores called calibrated probabilities without a reliability check; only successful examples shown; and ablations that change both data and architecture. Regenerate the report from saved predictions after every fix.
CineQC transfer
Propose a bounded routing policy: accept clear negatives, flag clear positives, and send an uncertainty band to human review. Preserve the deterministic baseline as fallback. State latency and review-volume implications, plus cases where the learned model should abstain. The benchmark informs integration; it does not deploy the model.
Self-check
What four identities must accompany a metric: dataset/test-set version, system/checkpoint version, threshold policy, and metric-code version?
Evidence gate
The Temporal Detector Benchmark passes when an evaluator can:
- verify identical fixed test-set IDs for model and baseline;
- run one command that recomputes precision, recall, F1, PR-curve points, and confusion matrices from saved predictions;
- trace the threshold to validation-set production cost rather than test optimization;
- inspect calibration evidence, two controlled ablations, and false-positive/false-negative galleries;
- read a model card covering intended use, data, metrics, limitations, privacy, and human review;
- reproduce a public demo while the private full evaluation remains explicitly private.
Prose-only metric numbers do not pass.
One-page summary
- Compare both systems on one fixed test set.
- Save predictions; recompute every published number.
- Precision, recall, and F1 answer different cost questions.
- PR curves sweep thresholds; confusion matrices describe one.
- Calibration is about probability meaning, not only ranking.
- Error galleries and ablations explain aggregate results.
- A model card constrains claims and records limitations.
Use the executable example to connect saved scores, threshold sweeps, precision, and recall. · 25 min
Inspect reliability diagrams only when detector scores are presented as probabilities. · 20 min
Temporal Detector Benchmark with recomputed metrics, a reproducible public demo, private full evaluation, model card, and narrated result.
Check the statements you can demonstrate in the challenge. Selections route your learning; they are not proof of mastery.
Start the full milestone.
Submit an inspectable artifact for independent review. Only a verified diagnostic challenge or reviewed evidence can mark this milestone proven. Proof is local self-tracking, not tamper-resistant against edits to this browser storage.
- Compare model and baseline on identical fixed test items.
- Calculate metrics and plots from saved predictions.
- Train the bounded temporal-artifact detector on sampled sequences and document its limitations.
Current state: not-started. Advance through learning, practice, and submitted evidence; proof requires a later passed review.
Your local study notes mount here when JavaScript is available.
Teaching modes mount here when JavaScript is available. The readable course remains available without them.